
DotMock 2.0 is live.
What began as a better way to mock an endpoint has grown into a controlled environment for the whole backend loop. Developers, test suites, and coding agents can model a dependency, break it on purpose, run the real client against it, inspect the result, reset the world, and go again.
We built this release for the moment a tidy integration test meets a messy distributed system.
A checkout bug has one favorite trick: it waits until the system is real. The payment provider times out after authorization. Its webhook arrives twice. Inventory responds slowly enough to trigger a retry, but not slowly enough to fail cleanly. Your application now has three individually reasonable responses and one thoroughly unreasonable customer experience.
Most development sandboxes will not line those conditions up for you on demand. A hand-written stub might cover the first response, but it rarely preserves state across calls, emits a signed webhook two seconds later, streams partial output, and records the exact branch your client matched. A coding agent can write the retry logic, but it cannot safely prove that logic by poking production.
DotMock 2.0 is a controlled environment around your backend. It gives developers, test suites, and coding agents realistic dependencies they can change, break, inspect, reset, and run again. Your application still uses its real SDKs and protocol clients. The systems on the other side are deterministic simulations that belong to your team.
The result is a tighter loop: describe the behavior, run the client against it, inspect what happened, fix the application, and repeat without waiting for a vendor sandbox or spending against a live provider.
From mock endpoints to controlled environments
Earlier versions of DotMock were centered on a familiar job: give an application a stable HTTP response while the real dependency is unavailable. That job still matters. Version 2.0 expands the boundary from a single response to the surrounding system behavior.
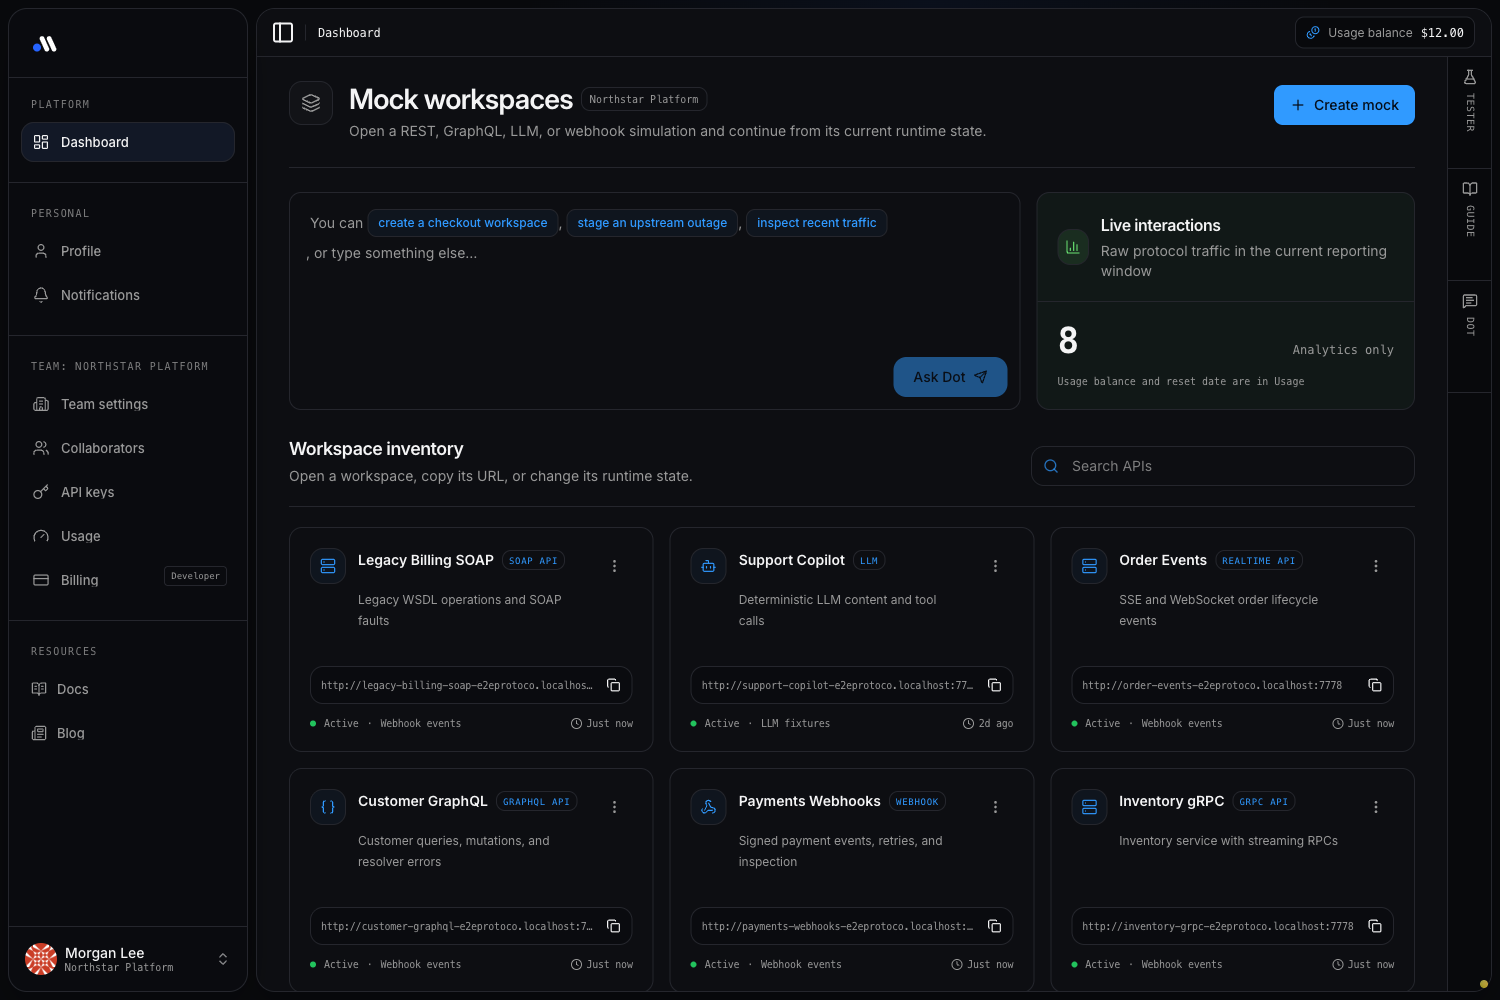
A DotMock workspace can now own the contract, conditional behavior, persistent state, failure modes, traffic history, and publish lifecycle for one dependency. A team can keep separate workspaces for checkout, identity, inventory, a support copilot, order events, and legacy billing while operating them from the same dashboard.

That distinction matters because integrations fail in sequences. A useful checkout simulation might need to:
- accept a payment method and create a pending authorization;
- time out on the first confirmation attempt;
- succeed when the client retries with the same idempotency key;
- emit a signed
payment_intent.succeededwebhook; - return the completed payment on the next lookup; and
- leave a traffic trace that explains every decision.
Those steps form one testable environment in DotMock 2.0. The response body is only one part of it.
Use the protocol your application actually speaks
Teams often inherit a stack of dependencies that arrived in different decades. A mobile app calls REST and GraphQL. Internal inventory uses gRPC. A bank still publishes WSDL. Notifications travel over WebSockets. AI features call provider-shaped LLM APIs and stream tokens over SSE. Payment results arrive as signed webhooks.
DotMock keeps those protocols native instead of squeezing every dependency through a REST-shaped abstraction.
REST and OpenAPI
Import an OpenAPI or Swagger document, or build the surface directly. Define methods, paths, parameters, headers, request bodies, reusable models, response schemas, and examples. Conditional responses can match request data, time, and persistent state. Faults cover transport failures such as latency, disconnects, and malformed responses. Response hooks can trigger durable follow-up behavior.
Proxy mode lets a workspace sit in front of a trusted upstream. Defined operations can be mocked while unknown requests continue to the real test service, and individual endpoints can override the default. Safe previews never contact that upstream.
GraphQL
Start from SDL and model GraphQL as GraphQL: queries, mutations, variables, arguments, aliases, validation errors, resolver failures, subscriptions, and persisted queries. Responses follow the client’s selection set, and operations can share persistent state. A mutation can create a record that a later query returns without inventing REST endpoints behind the scenes.
SOAP
Import WSDL and XSD contracts, route SOAP 1.1 and 1.2 envelopes, match with XPath, and return native XML or SOAP faults. SOAP workspaces use the same state and inspection model as newer protocols, which makes a legacy dependency testable without pretending it is JSON.
gRPC and gRPC-Web
Compile protobuf descriptors and author descriptor-valid messages for unary, server-streaming, client-streaming, and bidirectional calls. DotMock supports reflection, metadata, status codes, traffic replay, gRPC-Web, and managed TLS or mTLS proxy connections. Recorded traffic never changes mock behavior automatically; promotion remains an explicit review step.
LLM APIs
Point an OpenAI-compatible or provider-shaped client at DotMock and keep the real SDK path in your application. Fixtures can return deterministic content, tool calls, structured output, provider errors, usage fields, latency, and state changes for OpenAI, Anthropic, Gemini, Ollama, and compatible clients.
Streaming fixtures go beyond the final text. You can control time to first token, token rate, jitter, event order, truncation, malformed chunks, and disconnects over SSE or WebSockets. The friendly conversation view helps with application behavior; raw frames prove that the parser handled the protocol correctly.
Webhooks
Create reusable event definitions, render them before delivery, sign them, send them to a local listener or test target, and inspect each attempt. Provider presets cover Stripe, GitHub, Shopify, Twilio, and custom events. Deliveries retain rendered headers and bodies, signature details, status, latency, retry lineage, and history. A REST response can also schedule an eligible same-team webhook as a response hook.
Author and test in the same workspace
Mock configuration usually lives far away from the application test that depends on it. Someone edits a JSON file, restarts a process, runs a client, and then guesses whether the wrong response came from the matcher, the template, stale state, or the application itself.
DotMock 2.0 keeps the authoring canvas and the tester together. Select an operation and the tester follows it. Request examples come from the contract. You can add parameters and headers, switch between a safe dry run and live execution, and inspect the result without leaving the workspace.
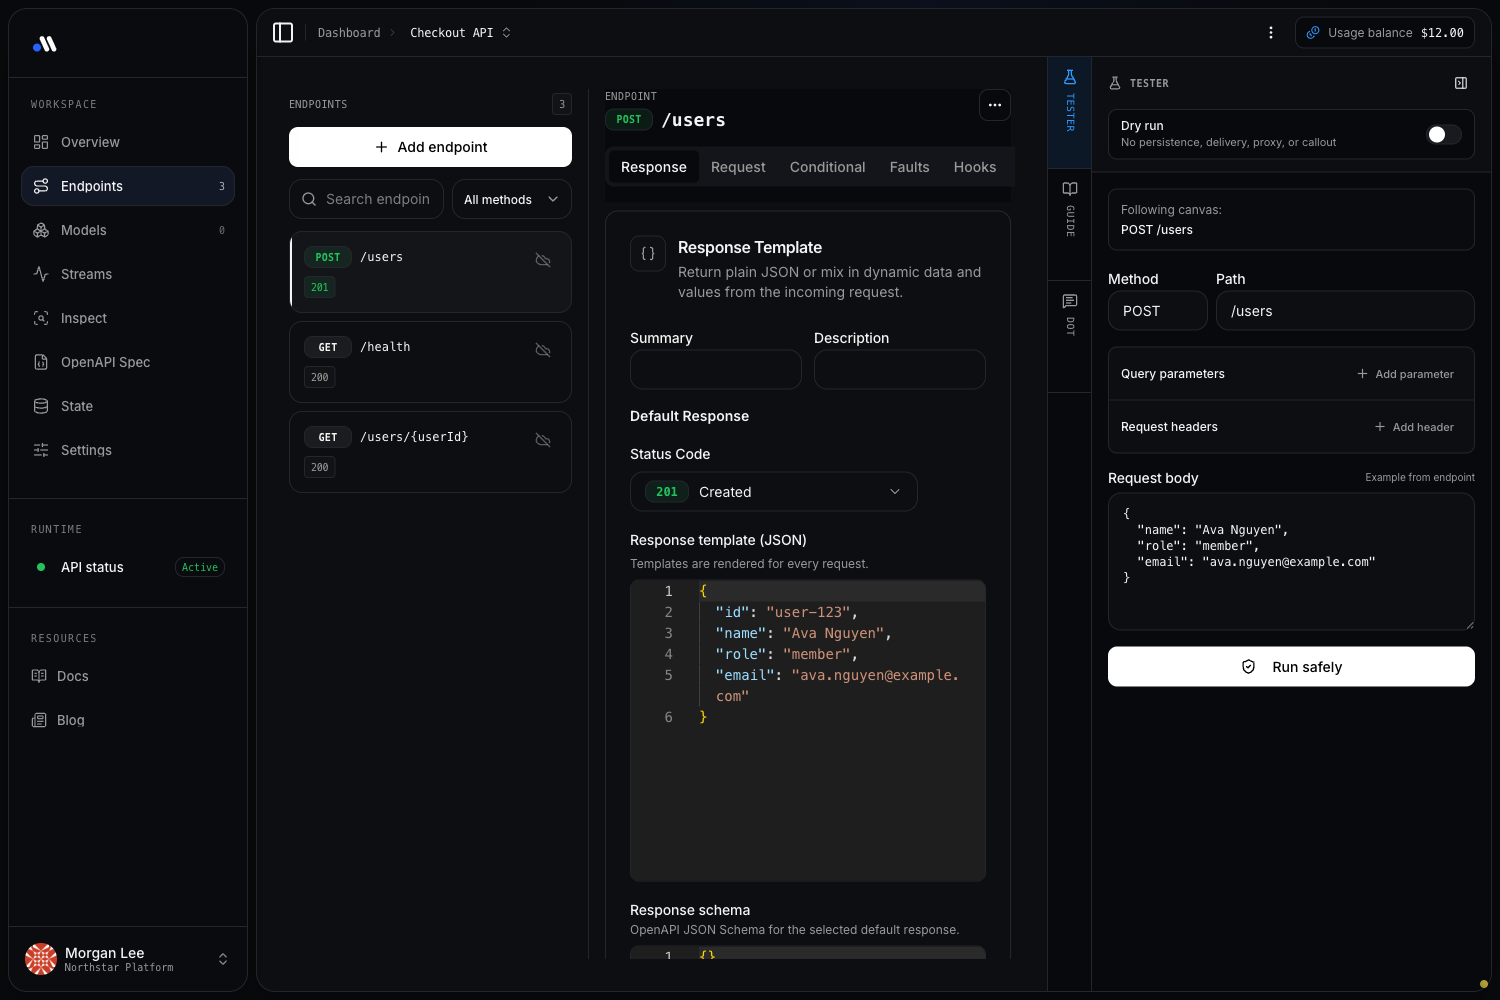
A dry run uses the real matching and rendering engine but does not persist state, deliver webhooks, call an upstream, or trigger external work. It returns the chosen behavior, rendered response, and projected state diff. Once the scenario is correct, the live mock URL exercises the path your application will use.
Determinism is deliberate. Fix the seed, clock, starting state, and scenario order when a test needs one exact answer. Use randomized chaos only in resilience suites that record their seed and accept multiple valid outcomes.
State turns isolated responses into workflows
Many bugs live between calls. A cart is empty, then contains an item, then expires. An idempotency key is unseen, then claimed, then reused. A job moves from queued to running to complete. A retry counter determines when a dependency finally succeeds.
DotMock state resources model those workflows with maps, counters, queues, sets, snapshots, and atomic actions. State is isolated by team, workspace, and API scope. Conditions and templates read from the same runtime that applies mutations, so a failed render does not leave half-written state behind.
Useful patterns include:
- store a created user by ID and return it from a later request;
- pop scripted outcomes from a queue to model timeout, timeout, success;
- increment a per-customer counter to enforce a test rate limit;
- track unique products or event IDs in a set;
- snapshot a scenario before a suite and restore it afterward; and
- preview the exact state diff before committing an authoring change.
If the state runtime is unavailable, state-dependent requests fail closed with a clear error. Stateless mocks can keep serving. Silent partial state is not treated as success.
Realtime behavior without hand-written socket servers
SSE and WebSocket clients have their own failure vocabulary: missed event IDs, reconnect storms, malformed frames, heartbeat gaps, fanout mistakes, and a connection that closes after the client has already updated local state.
The realtime workspace lets you author OpenAPI 3.2 SSE operations and AsyncAPI 3.0 WebSocket channels. Scenarios react to connect, inbound message, timer, and disconnect triggers. Declarative actions can send, join, leave, broadcast, update state, or close the connection. No user-provided script runs inside the runtime.
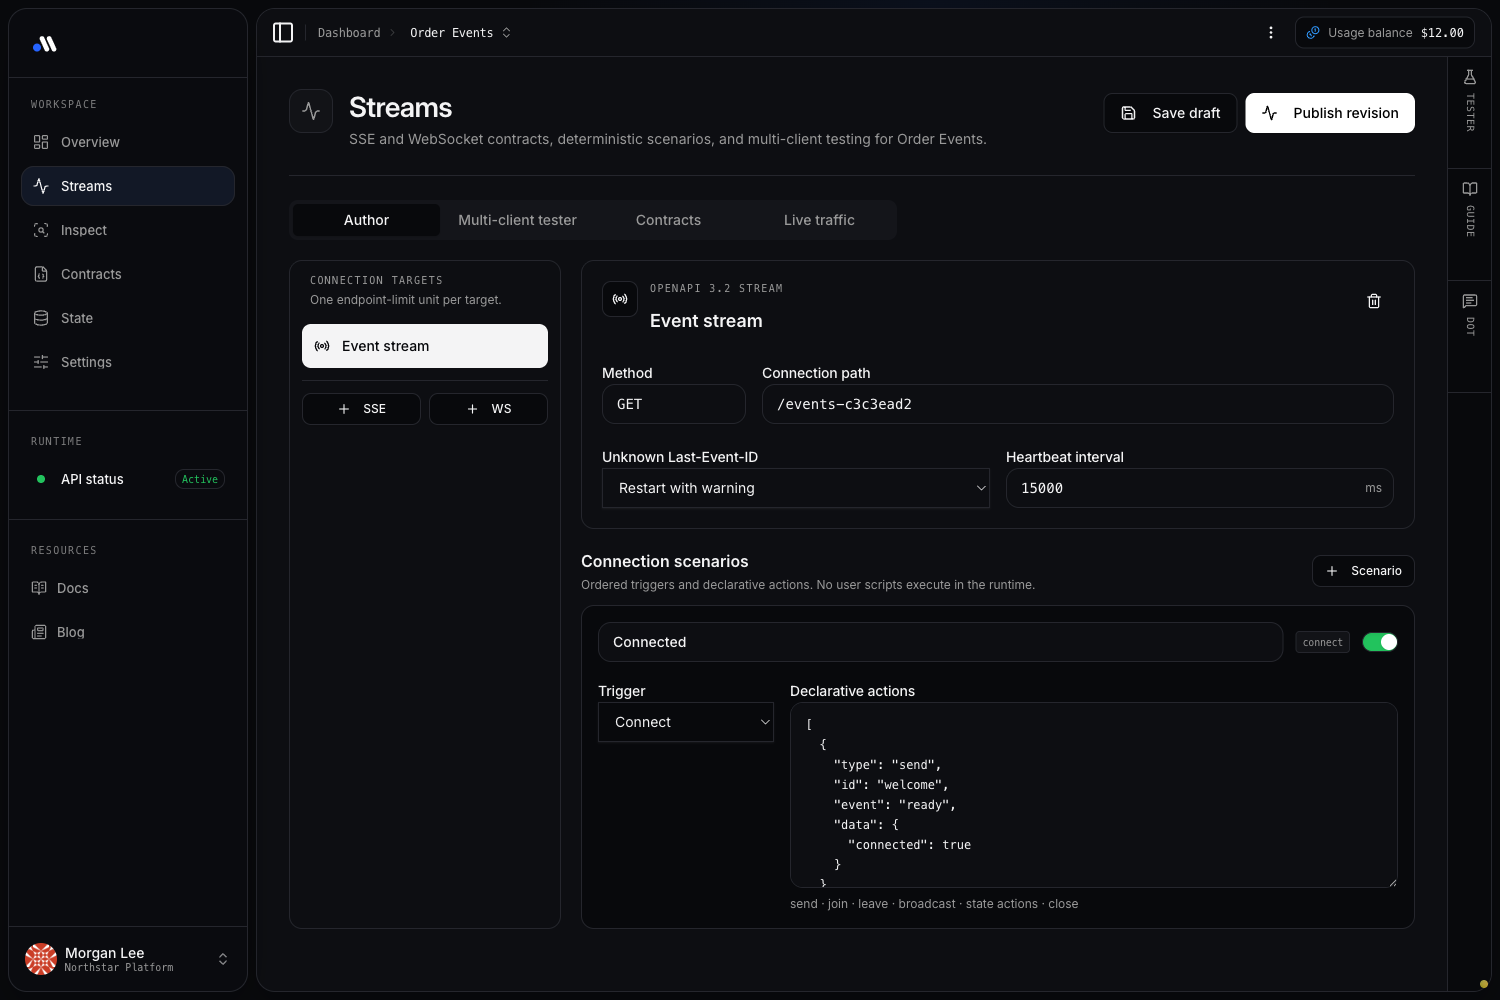
The multi-client tester can open several connections against the same scenario, which makes rooms, fanout, presence, and reconnection behavior observable. Live traffic records the timeline for each session.
Realtime usage is measured in outbound message-equivalents. Each started 16 KB of one outbound delivery counts as one equivalent. A broadcast multiplies those equivalents by its recipient count. Inbound traffic is not billed, although it still consumes safety-limit capacity. The published plans keep explicit concurrency, sustained throughput, burst, and connection-open limits so a runaway test fails predictably.
Traffic inspection explains the answer
A green status code is not enough when you do not know why it was selected.
DotMock traffic connects the observed request to the operation, fixture, condition, template, state effect, and response that handled it. REST requests remain structured HTTP data. GraphQL keeps operations and variables. gRPC keeps services, methods, metadata, messages, and status. LLM streams retain provider events. Webhooks keep delivery attempts and retry lineage. Realtime sessions keep frame timelines.
Near-miss diagnostics help when a request almost matched a scenario. That is safer than broadening a condition until the test turns green for the wrong reason.
Captured traffic can become useful authoring evidence, but it is never promoted automatically. Review credentials, cookies, personal data, and high-cardinality values before saving a recording into a shared definition.
Dot, CLI, and MCP share the same boundaries
Dot is the guide inside the product. From the team dashboard, it can help create a workspace, stage an outage, or inspect recent traffic. Inside an API, it inherits that workspace context. The site-wide tool rail keeps Dot, the tester, and the guide available while you move through the product.
The same platform is available from the DotMock CLI and MCP server. A developer can work in the dashboard, a CI job can run deterministic checks from the repository, and a coding agent can inspect or propose changes through typed tools.
Authority is part of the feature. Tool access is bounded by the current user or API key, team membership, role, scope, and action type. Secret-bearing steps stay in trusted UI flows. Dot and ordinary MCP tools do not ingest upstream credentials, private keys, payment details, or realtime-token secrets. Destructive actions remain approval-aware, and failed tools cannot be presented as successful changes.
This makes a practical agent loop possible:
- inspect the dependency contract and current workspace;
- propose a bounded behavior change;
- preview it with the real runtime;
- apply the approved draft;
- run the application against the mock;
- read the traffic trace; and
- fix the application or the scenario with evidence.
The agent can move quickly because the environment is disposable. It cannot quietly widen its own authority.
A usage balance you can reconcile
DotMock 2.0 replaces a patchwork of request counters with one USD-denominated usage balance. The header shows a readable two-decimal amount. The usage view retains exact quantities, units, operations, workspaces, and all six microdollar decimals in the underlying ledger.
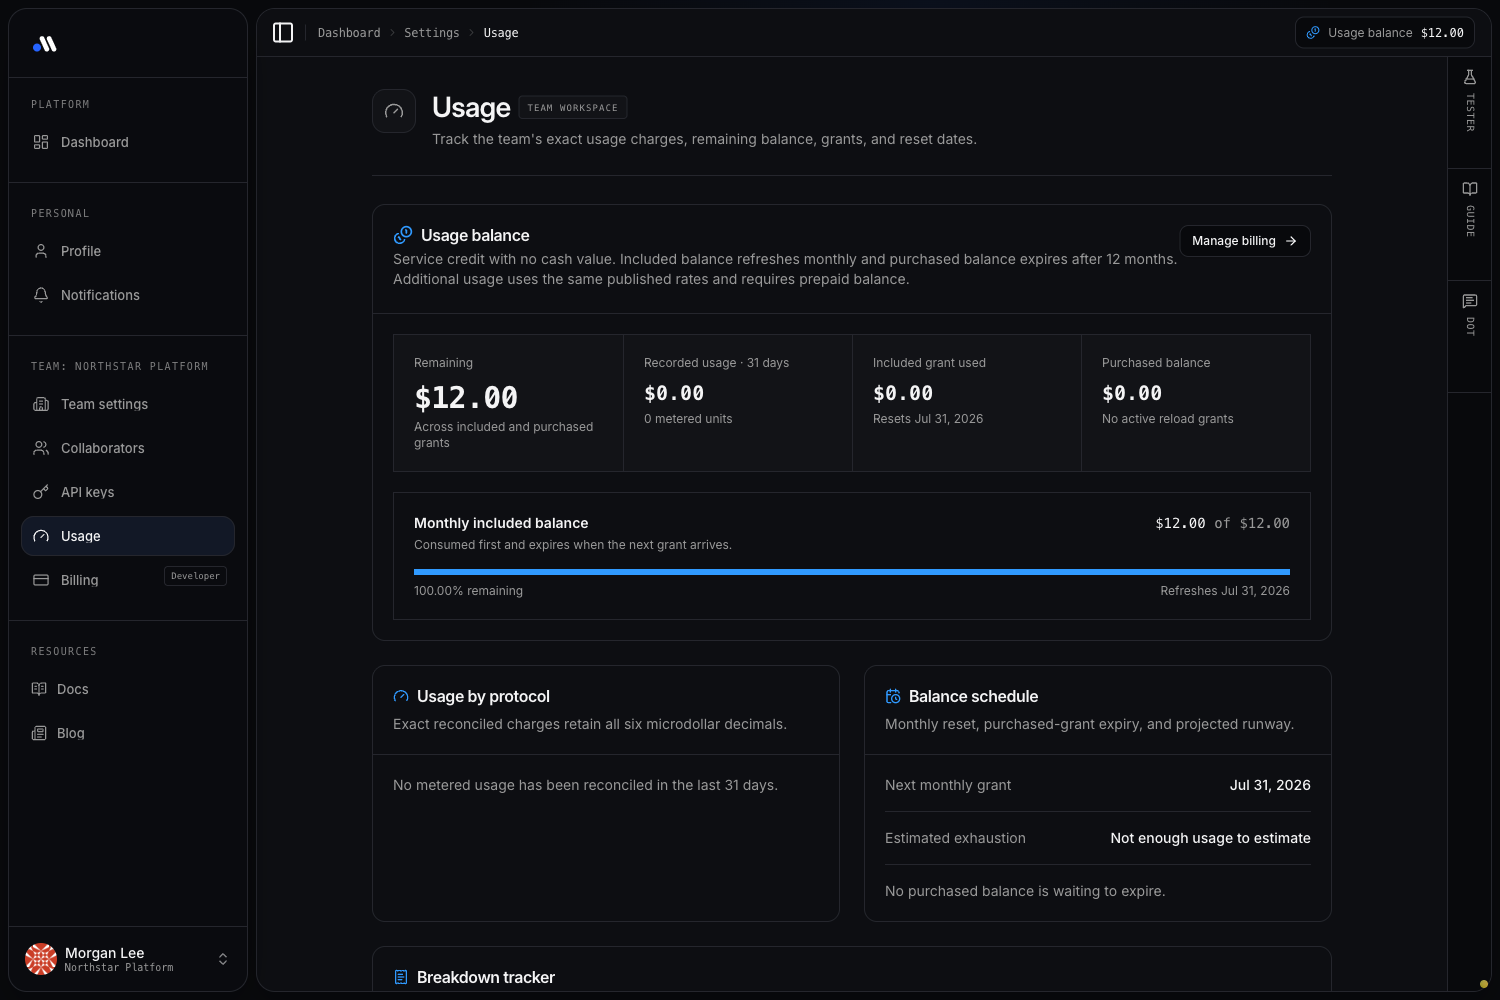
Known runtime costs, such as deterministic requests and outbound stream deliveries, debit atomically and aggregate into minute buckets before reaching the durable PostgreSQL ledger. Provider-backed work follows a reservation path because the final provider cost is not known in advance: reserve the maximum, execute, then commit the actual amount or release the remainder.
Included monthly balance is consumed first. Purchased reload grants follow by earliest expiry and remain valid for 12 months. Auto-reload evaluates the live balance rather than waiting for a delayed report. If balance state is unavailable, paid execution fails closed instead of guessing.
The public plans now line up price and included monthly usage:
- Free: $1 in monthly usage, one active workspace, five concurrent realtime connections, and manual authoring without provider-backed Dot.
- Developer: $12 per month with $12 in monthly usage, three active workspaces, Dot, and 20 concurrent realtime connections.
- Team: $49 per month with $49 in monthly usage, 20 active workspaces, unlimited collaborators, shared approvals and audit history, and 100 concurrent realtime connections.
- Enterprise: custom usage, concurrency, controls, security review, and rollout support.
Annual Developer and Team plans cost ten months of the monthly price while the included balance still refreshes each month. Additional usage uses the same published rates and requires prepaid balance.
Where DotMock 2.0 fits
Build the frontend before the backend integration is ready
Import the contract, add realistic examples and failure branches, and give frontend developers a stable URL. When the real service arrives, the application already handles loading, validation, empty states, errors, and retries.
Give coding agents a safe integration target
An agent can run the application, call a deterministic dependency, inspect the trace, and revise its code without live vendor credentials. The environment can be reset between attempts, so fast iteration does not create mystery data.
Make CI failures reproducible
Fix the seed and state, run the same scenario in every build, and assert both the response and its side effects. A failed job leaves a protocol-aware trace instead of a screenshot and a guess.
Recreate production incidents without production traffic
Model the timeout, duplicated event, stale read, malformed chunk, or disconnect that caused the incident. Keep the scenario as a regression test after the application is fixed.
Test event-driven and streaming clients
Exercise WebSocket rooms, SSE resume behavior, gRPC streams, LLM token events, and signed webhook retries from one environment. Control timing and ordering instead of hoping a sandbox behaves badly at the right moment.
Migrate SDKs and providers
Keep the application’s real client path while changing the base URL. Compare old and new request shapes, error handling, streaming semantics, and tool-call parsing before live credentials enter the loop.
Run demos and onboarding with a known world
A demo should not depend on a third-party sandbox having a good day. Give every workshop, sales call, or new teammate the same starting state and the same recoverable scenarios.
Start with the failure you cannot summon
Pick one dependency that slows your team down. Import its contract or create a workspace, then model one behavior the real sandbox will not reliably give you: the second webhook, the timeout after authorization, the malformed stream, the resolver error, or the retry that finally succeeds.
Run your application against that behavior. Inspect the trace. Reset it and run it again.
DotMock 2.0 is available now. Build your first controlled dependency, review the DotMock 2.0 documentation, or compare the current plans and included usage.