How to Test Network Latency Accurately
To get a real handle on network latency, you need the right tools to measure Round-Trip Time (RTT). This is simply how long it takes for a chunk of data to travel from point A, reach point B, and come all the way back. The most basic, go-to tools for this are command-line utilities like ping and traceroute. They give you a quick and dirty measurement in milliseconds (ms), offering an immediate feel for how responsive your connection is.
What is Network Latency and Why Does It Matter?
Before you start running diagnostics, it's crucial to know what you're actually measuring and why it's such a big deal. People often call network latency "delay" or "ping," but at its core, it's the time it takes for a single packet of data to make that round trip. A good analogy is hearing an echo—the longer it takes for the sound to bounce back, the farther away the wall is, or the more stuff is in the way.
This delay isn't just something that competitive gamers need to worry about. High latency can make a mess of everyday online activities in ways that might surprise you.
- Video Conferencing: Ever find yourself accidentally talking over someone on a Zoom call? A delay of just 150ms is enough to cause that awkward conversational overlap, derailing the flow of a meeting.
- Cloud Applications: If you’re working in a collaborative tool like Google Docs or Figma, high latency creates a noticeable lag between your clicks and the app's response. It’s a surefire way to kill your productivity.
- Financial Transactions: In the world of stock trading or online payments, every millisecond counts. High latency can be the difference between a successful trade and a missed opportunity, or worse, a failed transaction.
Key Latency Metrics at a Glance
As you start to measure network performance, you'll run into a few core concepts. Getting these down is the first step to figuring out what's really going on with your connection.
| Metric | What It Measures | Why It's Important |
|---|---|---|
| Round-Trip Time (RTT) | The time (in ms) for a data packet to travel from a source to a destination and back. | This is your primary indicator of responsiveness. Lower RTT means a snappier connection. |
| Jitter | The variation in latency over time. If your RTT fluctuates wildly, you have high jitter. | Jitter is the enemy of real-time applications, causing video to freeze or voice calls to stutter. |
| Packet Loss | The percentage of data packets that never reach their destination. | Even a tiny amount of packet loss can corrupt files, degrade call quality, or cause applications to fail. |
Understanding these three pillars—latency, jitter, and packet loss—gives you a complete picture of your network's health and reliability.
The Bottom Line: Latency isn't about raw speed. You can have a massive, high-bandwidth connection that still feels sluggish if the latency is high, because every single interaction is met with a frustrating delay.
Beyond just the raw delay, jitter and packet loss are critical for a full understanding of network health. An unstable connection with high jitter feels unpredictable and choppy. Meanwhile, packet loss happens when data just vanishes en route. Even losing 1-2% of packets can bring a video call to its knees or corrupt a file download.
Knowing how these issues manifest is especially vital when you're building software. To get a better handle on how developers can simulate these kinds of real-world network problems during testing, you should check out our guide on what is service virtualization.
Your First Steps in Latency Testing

You don't need a fancy suite of tools to start digging into network performance. In fact, some of the most essential utilities for a quick latency check are probably already on your computer. I'm talking about ping and traceroute, the old-school workhorses of any network diagnostic, accessible right from your command line or terminal.
Think of the ping command as your network's sonar. It sends a tiny packet of data—an ICMP echo request—to a target server and simply listens for the echo. The time it takes for that packet to make the full journey and return is your Round-Trip Time (RTT). It's a fantastic, immediate snapshot of how responsive your connection is to a specific destination.
Running a ping is easy enough, but the real skill is in interpreting what it tells you.
Decoding Your Ping Results
When you fire off a ping test, you get a series of replies, each with a time measured in milliseconds (ms). It’s tempting to just glance at the average, but the real story is in the consistency of those numbers.
- Low and Stable RTT: Seeing steady times under 50ms? That's a great sign. Your connection to that server is probably rock-solid and responsive, perfect for things like gaming or VoIP calls.
- High but Stable RTT: What if the numbers are consistently high, maybe over 150ms? It's not great, but a stable, predictable delay is often easier to work with than one that’s all over the place.
- Fluctuating RTT (High Jitter): This is the killer. If your times are jumping from 30ms to 200ms and back again, you've got high jitter. That instability is what leads to stuttering video calls and frustrating lag spikes in the middle of a game.
This whole process of sending out probe traffic to see what comes back is a form of active latency measurement. While ping is my go-to for a quick check, it's not the whole story. It only measures the performance of the ICMP protocol. Some networks treat this type of traffic as low-priority or even block it entirely, so your ping results might not perfectly reflect the performance of your day-to-day web traffic. It’s worth reading up on active measurement techniques to get a fuller picture of network behavior.
Pro Tip: Whenever you're testing latency, plug directly into your router with an Ethernet cable if you can. Wi-Fi is incredibly convenient but also prone to all sorts of interference that can muddy your results. You might end up chasing a "slow internet" problem when the real culprit is your local wireless network.
Following the Path with Traceroute
So, your ping results show high latency. The immediate next question is, where is that delay coming from? Is it something on your local network? Your ISP? Or a server halfway across the world? This is exactly what traceroute (or tracert on Windows) is built to answer.
Traceroute works by mapping out every single "hop" or router your data passes through on its way to the destination. For each hop, it reports the RTT, effectively giving you a turn-by-turn breakdown of the journey and how long each leg took.
By looking at the output, you can spot the bottleneck. If the latency suddenly spikes right after the packet leaves your home network and hits your ISP's equipment, the problem is likely on their end. On the other hand, if the times are great all the way until the very last hop, the issue is probably with the destination server itself. In just a few seconds, this command can turn a vague complaint like "the internet is slow" into a piece of actionable evidence.
Going Deeper With Advanced Latency Tools
Sometimes, the trusty old ping and traceroute commands just don't cut it. They’re great for a quick spot-check, but when you're chasing down those maddening, intermittent lag spikes that vanish the second you start looking, you need something more powerful.
This is where specialized tools come into play. Instead of giving you a single snapshot in time, they offer a continuous, real-time view of your connection's health. This makes it far easier to catch those elusive problems as they happen and figure out not just if there's an issue, but precisely where it's originating.
Getting a Continuous View with MTR
One of my go-to tools for this is MTR, which stands for My Traceroute. I like to think of it as ping and traceroute combined into one super-tool. MTR constantly sends packets to a destination and shows you the latency and packet loss for every single hop along the way, all in a table that updates in real-time.
This dynamic view is a total game-changer. Let's say you’re getting booted from an online game. You can run MTR to the game server's address and just let it run for a few minutes. You'll be able to see if a specific router somewhere in the middle of the path suddenly starts dropping packets or if its latency shoots through the roof, pointing you directly to the culprit.
You will have to install MTR yourself, as it isn’t typically included by default on most operating systems. But once it's set up, using it is just as easy as the basic commands you’re already familiar with.
Making Sense of Latency with Visual Monitoring
While command-line tools like MTR are incredibly powerful, staring at a wall of text and numbers can be tough, especially when you're trying to identify trends. This is where modern network monitoring platforms with graphical interfaces really prove their worth. These tools gather latency data over time and display it in charts and graphs that are much easier to digest.
Seeing latency plotted on a timeline makes patterns jump out at you. You might discover that your connection gets sluggish every weekday around 5 PM—right when the whole neighborhood gets home and starts streaming. Or you could see a sharp, sudden latency spike that lines up perfectly with a service outage your ISP just reported.
For developers, this kind of visibility is essential for understanding how real-world network conditions affect application performance. A great way to get this level of insight is by learning more about capturing and analyzing live traffic to see what your users actually experience.
The visual below breaks down how to interpret the results you might see in these kinds of diagnostic charts.
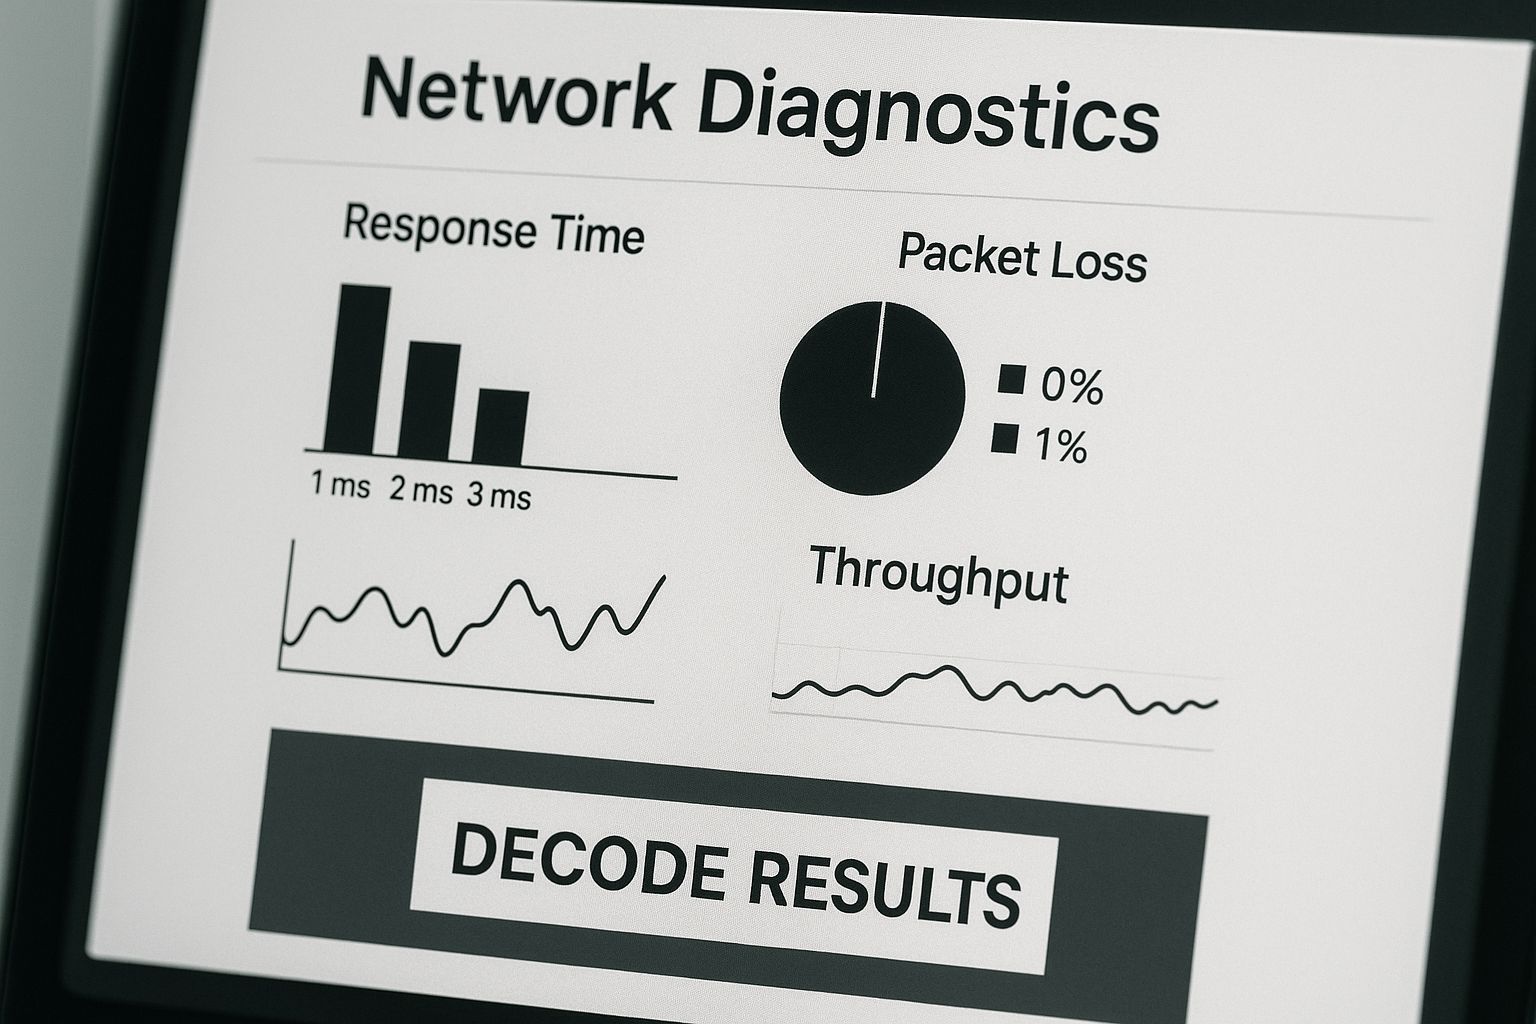
This kind of visualization helps bridge the gap between raw data and genuine, actionable insights into your network's behavior.
Comparison of Latency Testing Tools
Choosing the right tool really comes down to what you're trying to accomplish. A quick check doesn't require the same firepower as diagnosing a persistent, complex issue. This table breaks down some of the most common tools to help you decide.
| Tool | Best For | Key Feature | Complexity |
|---|---|---|---|
| ping | Quick, simple reachability tests. | Sends a few packets to see RTT. | Very Low |
| traceroute | Mapping the path to a destination. | Shows each hop and its latency. | Low |
| MTR | Diagnosing intermittent issues. | Combines ping and traceroute in real-time. | Medium |
| Monitoring Platforms | Long-term analysis and trend spotting. | Visual dashboards and historical data. | Medium to High |
Ultimately, having a mix of these tools in your arsenal gives you the flexibility to tackle anything from a simple connection test to a deep-dive investigation.
The real advantage of these advanced tools is their ability to track performance over time. A single high ping might just be a random fluke, but a chart showing consistently high latency every evening points directly to a clear problem, like network congestion, that you can actually solve.
By moving past one-off tests, you can build a complete picture of how your network behaves. This data-driven approach is the most effective way to truly understand and fix those frustrating, complex latency problems.
How Developers Can Simulate Network Latency

It's a classic developer scenario: your application runs like a dream on the super-fast local network, but the moment it hits the real world, things start to break. For any developer serious about building robust software, testing for unpredictable network conditions isn't just a nice-to-have—it's a core part of the job.
By simulating network latency, you get a real look at how your application behaves under stress. It's how you proactively find and fix frozen UIs, janky loading states, or frustrating timeouts long before they ever reach your users.
Start with Browser Developer Tools
The simplest way to get started is already built right into your browser. Chrome, Firefox, and Edge all come packed with developer tools that can throttle your network connection with just a couple of clicks.
Just open up the developer console, head to the "Network" tab, and you'll find a dropdown menu with presets that mimic different connection speeds.
- Fast 3G: Great for simulating a user on a decent mobile connection.
- Slow 3G: Mimics what happens when someone's in an area with spotty reception.
- Offline: Instantly cuts the connection so you can test your app’s offline mode or PWA features.
These presets are my go-to for quick checks on the front end. You can instantly see if your loading spinners show up when they're supposed to or if the page is still usable while heavy images are downloading in the background. It's a foundational first step for any web developer.
My Personal Tip: While the presets are handy, I almost always create a custom throttling profile. I'll add about 150ms of latency to mimic a more realistic cross-country connection. This simple tweak often uncovers subtle timing bugs that the default "Slow 3G" setting doesn't catch.
Using Advanced Network Emulation Software
Browser tools are perfect for quick front-end checks, but they're limited. They don't give you the fine-grained control needed to simulate more complex network issues like jitter or packet loss. For that, you need to bring in dedicated network emulation software.
These tools work at a much deeper level, letting you manipulate network traffic for your entire machine or even just one specific application. This is absolutely critical for testing the full stack, especially API calls and backend services. For example, you can see how your app handles an API call that suddenly experiences 5% packet loss—a scenario browser tools just can't touch.
Some of the most popular options include:
- Charles Proxy: Lets you throttle bandwidth and inject latency on specific requests.
- Fiddler: A free web debugging proxy that includes features for simulating old-school modem speeds.
- Built-in OS tools: If you're on Linux,
tc(Traffic Control) is incredibly powerful. For macOS users,Network Link Conditioneroffers fantastic system-wide simulation.
Stepping up to these more powerful tools is key to a truly comprehensive testing strategy. By precisely controlling delay, jitter, and packet loss, you can build an application that stays smooth and resilient, even when the network is anything but perfect.
How to Make Sense of Your Latency Test Results
Running a latency test is easy. The real work begins when you have to turn a bunch of numbers into a clear story. A raw list of milliseconds doesn’t tell you a thing without context, but learning to read the results is how you find—and fix—the real cause of a slow connection.
First things first, you need a baseline. What does "good" latency even mean for what you’re doing? The acceptable delay for streaming a movie is a world away from what a competitive gamer needs.
- Gaming & VoIP Calls: If you're under 50ms, you're in great shape. Everything will feel snappy and responsive. Creep up into the 50-100ms range, and you might start to feel a subtle delay, but it's usually manageable.
- Web Browsing: You can get away with latency up to 200ms here. It won't be lightning-fast, but it’s often tolerable for day-to-day browsing.
- Video Streaming: Services like Netflix are built for this. They buffer content ahead of time, making them far more forgiving of higher latency as long as your bandwidth can keep up.
Did You Test It Right? Common Mistakes to Avoid
Before you tear your hair out over a high number, double-check that your results are actually reliable. It’s surprisingly easy to get skewed data from a flawed test. The biggest mistake I see? People running tests over Wi-Fi. Always, always plug in with an Ethernet cable if you can. It eliminates a ton of potential interference from your local network.
Another classic pitfall is freaking out over one high-latency hop in a traceroute. A single router in the middle of the path with a big number doesn't automatically mean there's a problem, especially if the final destination's latency is low. You have to look for patterns, not just single spikes.
A one-off high latency reading can just be a fluke. What you're really looking for are consistent, repeatable patterns—like a specific hop that's always slow or a connection that drags at the same time every day. That’s a real clue.
Reading the Patterns to Find the Bottleneck
With clean data in hand, it's time to play detective. Is your latency always high, or does it spike at 8 PM every night? These patterns are what help you figure out if the problem is in your house, with your Internet Service Provider (ISP), or somewhere on the way to the server you’re trying to reach.
This isn't just a small-scale problem. A fascinating study from Google Research on large-scale latency measurement showed just how much internet route changes can cause latency to fluctuate wildly. Their solution was clever: a sliding percentile method that only considered the most recent data points, which helped stabilize their measurements significantly.
Their work really drives home the point: you need to collect data over time. A single snapshot can be misleading. By looking at a bigger picture, you can finally separate the random noise from a true, persistent bottleneck. And that's how you get one step closer to actually fixing it.
Frequently Asked Questions About Latency Testing
https://www.youtube.com/embed/5G9REjqE-fs
Once you've run a few diagnostics, you'll probably start having some practical questions. Let's tackle some of the most common ones we hear about network latency testing. This should help you fine-tune your process and make better sense of your results.
What Is a Good Latency Measurement?
Honestly, there's no magic number. A "good" latency measurement is completely relative to what you're doing. Different applications have vastly different tolerances for delay.
What feels lightning-fast for one task can be painfully slow for another.
- Competitive Gaming & VoIP: If you're into online gaming or rely on voice calls, you want this as low as possible. Anything under 50ms is considered excellent and keeps the experience feeling instantaneous.
- Everyday Web Browsing: For just surfing the web, a latency of up to 200ms is generally acceptable. You might notice a slight lag, but it's usually not a dealbreaker.
- Video Streaming: Services like Netflix are smart about this. They buffer content ahead of time, which makes them far more forgiving of higher latency, as long as your bandwidth can keep up.
The key is to align your network's performance with its main job.
Why Are My Latency Test Results Inconsistent?
If your numbers are all over the place, you're experiencing jitter. This is an incredibly common issue, and it usually points to a few usual suspects.
Network congestion is the biggest one, especially during peak usage times when everyone in your neighborhood is online. Your own local network can also be a factor—think of other devices hogging Wi-Fi bandwidth or causing interference.
The internet isn't a single, straight road; it's a dynamic web of connections. The path your data takes can change from one moment to the next, which naturally leads to different travel times. For the most reliable readings, plug directly into your router with an Ethernet cable and run tests at various times of the day to get a true baseline.
Can I Test Network Latency to a Specific Application?
Absolutely, and it's one of the best ways to diagnose a specific performance problem.
First, you need the server's IP address or domain name. For a website, this is easy—it’s just the domain itself. For a game or another online service, you might need to do a little digging in the application's settings or on a community forum to find the server address.
With that address in hand, you can use tools like ping and traceroute to measure your latency directly to that specific server. This approach gives you a much more precise picture of the performance for the service you actually care about.
For developers, this concept is fundamental. It's not just about a single connection; it's about understanding how all your API dependencies behave under stress. This is where learning what is contract testing becomes so valuable, as it helps you bake reliability into your services from the start.
At dotMock, we give developers and QA teams the power to build more resilient software by simulating these exact network conditions. You can create mock APIs that mimic high latency, network timeouts, and other real-world headaches in just a few seconds. Start building unbreakable applications today.